


 Download(8.77MB)
 0.9.14
 1022.29KB
8.8
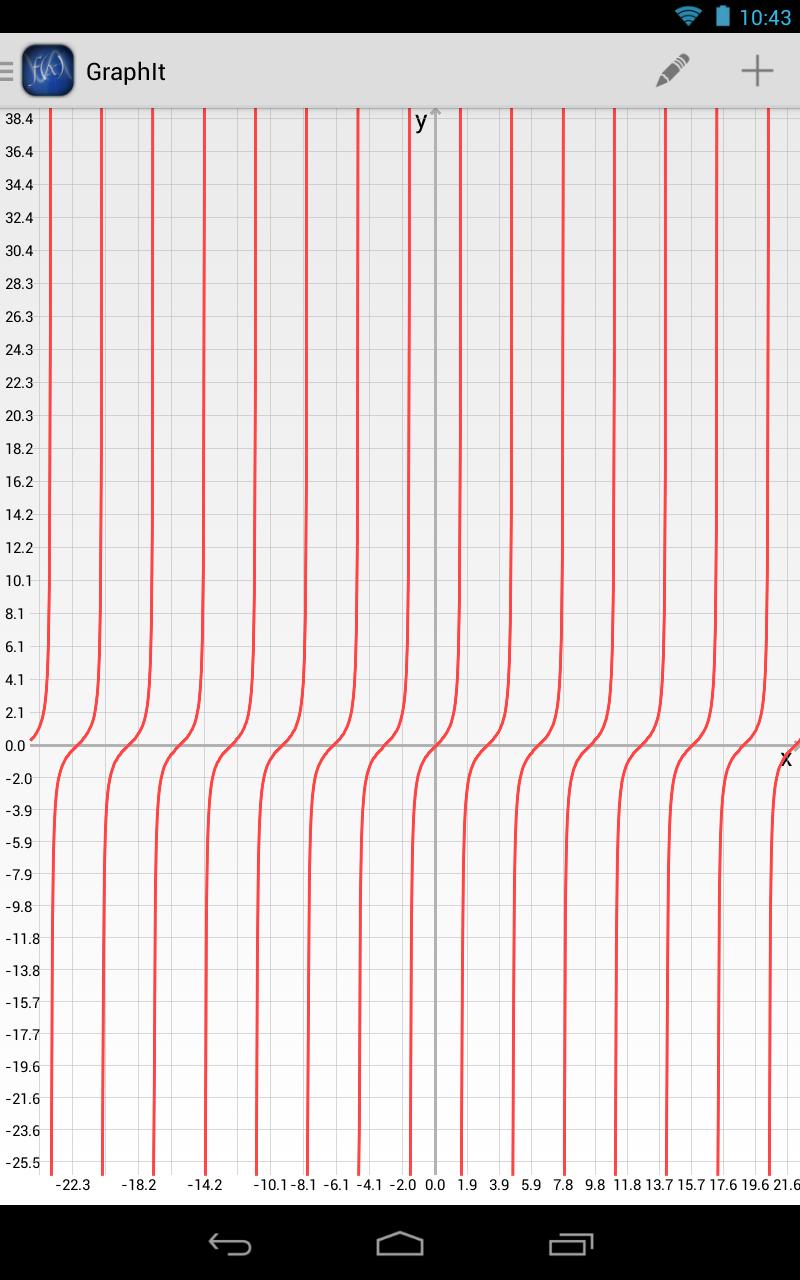
Draw any mathematical function in a Cartesian plane with Graph It!
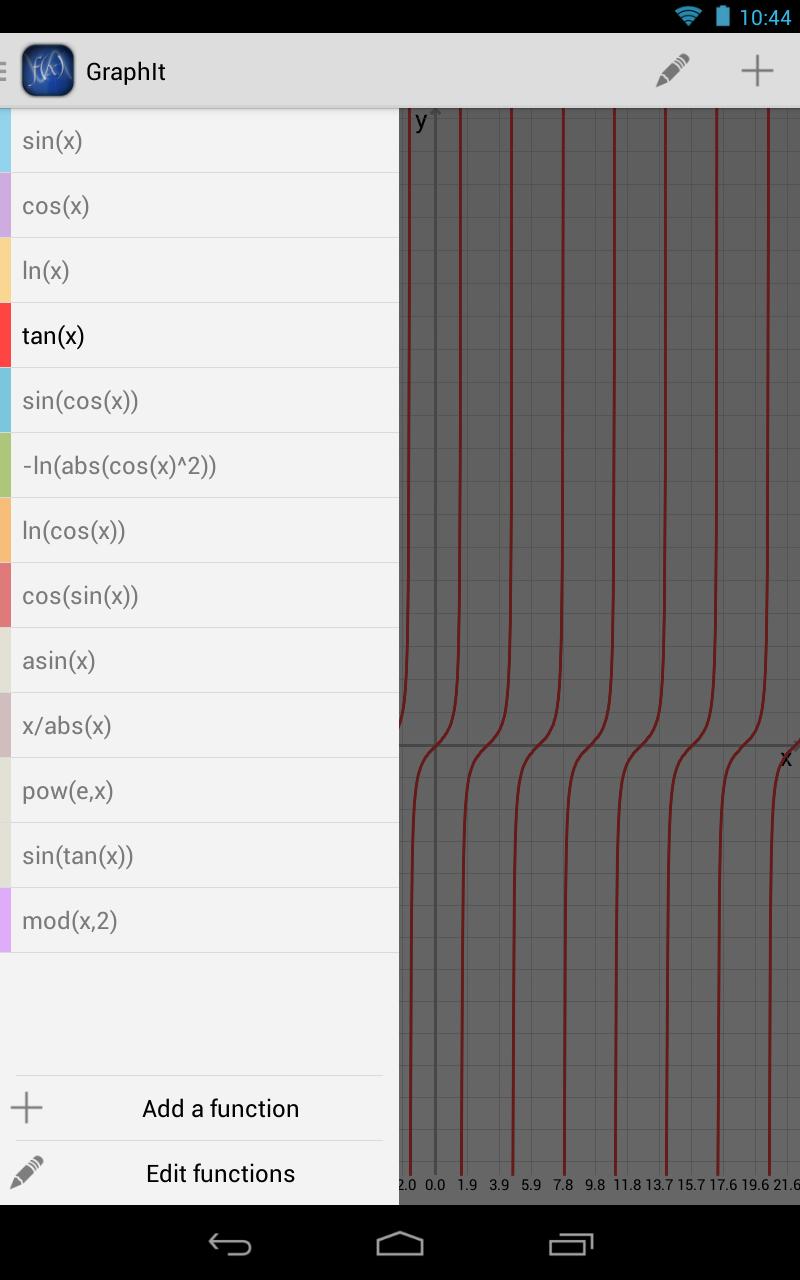
GraphIt is a utility that is used to display on a Cartesian plane any mathematical function, which can be f(x)=2, f(x)=2*x, f(x)=sin(x) ecc... The management function is entrusted to you: you can add more or modify existing ones.
The integration of functions is facilitated by self-completion of statements, also expressions of the interpreter is very flexible and allows the inclusion of any function: even the most complex are recognized and interpreted correctly.
The main functions recognized are: abs(x), acos(x), acosh(x), asin(x), asinh(x), atan(x), avg(x1,x2,...,xN), ceil(x), combin(x,y), cos(x), cosh(x), e(), exp(x), fact(x), floor(x), lg(x), ln(x), log(x,y), max(x1,x2,...,mN), min(x1,x2,...,xN), mod(x,y), pi(), pow(x,y), rand(), sign(x), sin(x), sinh(x), sqrt(x), sum(x1,x2,...,xN), tan(x), tanh(x), toDeg(x), toRad(x).
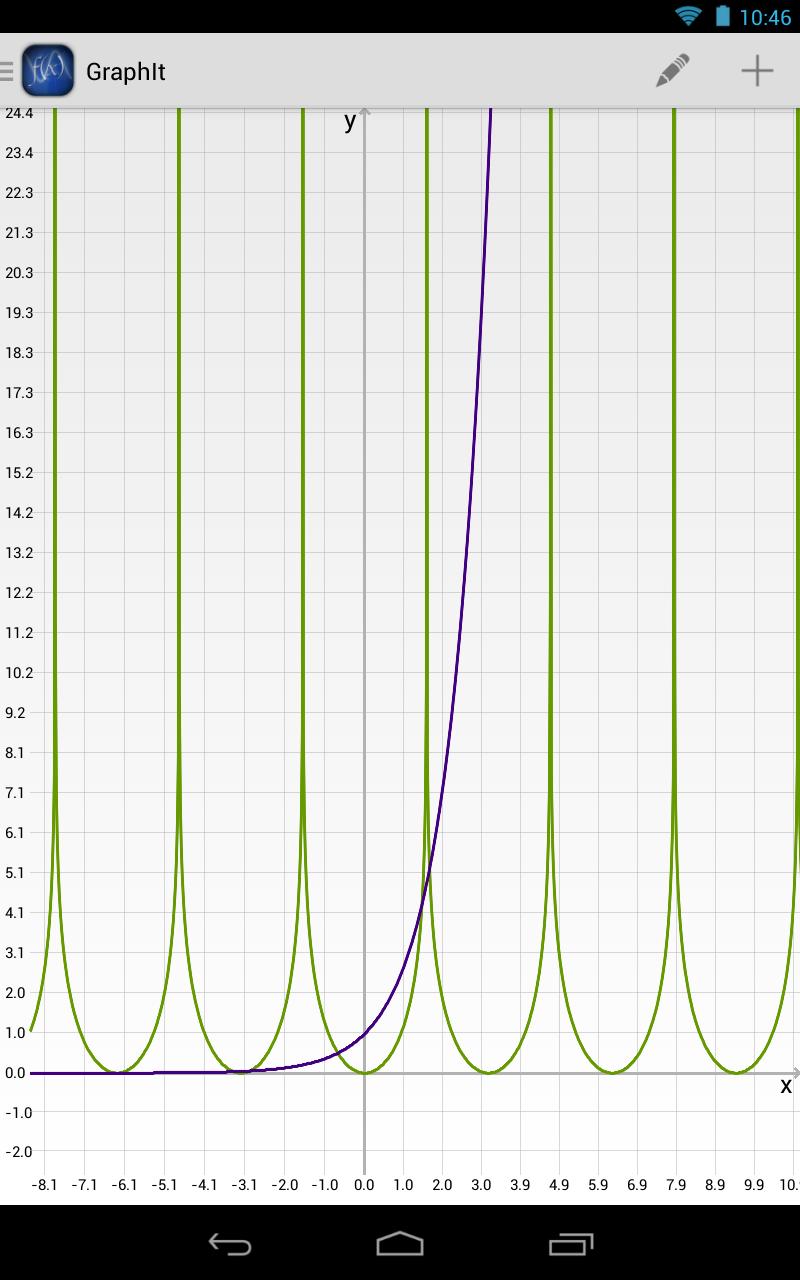
The graph allows an accurate view of the trend of function at any point in the plane. You can zoom and pan through the classical gestures.
There is also a tool which can calculate the value of the functions included, given the value of x (via a number or expression).
 Similarity
January 22, 2026
January 22, 2026
January 21, 2026
January 20, 2026
January 19, 2026
January 18, 2026
January 18, 2026
January 18, 2026
January 17, 2026
January 17, 2026
January 17, 2026
January 17, 2026